How To Solve The Marketing Spend Mystery

Jonathan Remis

I’ve looked at hundreds of analytics accounts for schools. Different sizes, different markets, different budgets. But almost every school asks the same question: “Is this working?”

I’ve looked at hundreds of analytics accounts for schools. Different sizes, different markets, different budgets. But almost every school asks the same question: “Is this working?”
If you’ve asked this, you’re in good company.
From my biased perspective, digital marketing is the #1 question for all schools. Schools want to know if what they’re doing is working. But it’s much harder to get a straight answer to this question than it should be. Why? Because digital marketing is something anyone can make look convincing.
Here is where I will plug our complimentary analytics review. Our team will review your analytics account, tell you what’s working, what’s not, and give you recommendations on how to improve. The best part is you can take those recommendations back to your team or provider and never speak to us again. However, if you’re not interested in filling out for our extremely short form your free analytics review, this is how I’d sanity check your analytics.
Step 1 – How are people actually finding you?
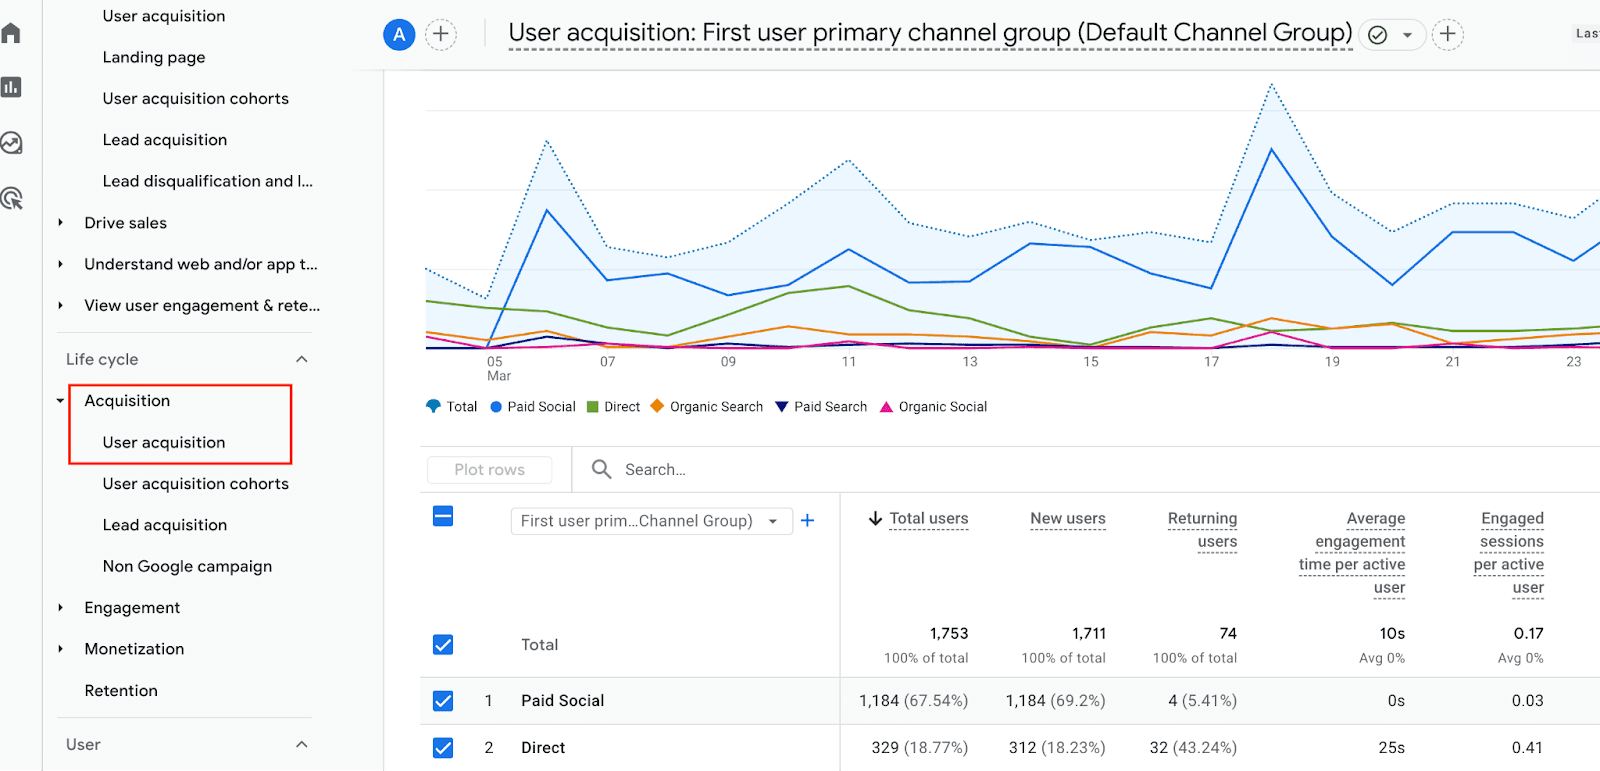
Log into your analytics and click on ‘Reports’ → ‘Acquisition’ → ‘User Acquisition’ (Depending on how your analytics are set up, it may be under “Reports” → “Generate Leads” → “User Acquisition”). This report shows where your traffic comes from and is one of the fastest ways to tell if things are adding up.
For most schools, Organic Search should be your top source of traffic. This shows how many users find you through Google (or Bing!). Next is usually Direct Traffic, i.e. typically users who already know your school and are coming back (think current families). After that, you’ll see a mix of other channels, including paid.
Here’s the important part.
If you’re paying for ads, you should clearly see Paid Search or Paid Social in your traffic sources list. If you don’t, something is off. If those channels do show up, look a level deeper. What’s the percentage of ‘Engaged Sessions’? What about the ‘Average Engagement time per session”? If both those numbers look unusually small, something ain’t working.
This is where I would like to talk about ‘event’ and ‘key event’ data, but GA4 has done such a disservice to these metrics and devalued their relevance, that instead, I’m going to blatantly shill Aryval. Instead of using those two metrics in GA4, our platform can tell you the name of the inquired family, the marketing source they came from, and location data, including zip codes.
Want to see how Aryval works in action? Fill out the form here.
The new question: What about AI?
There’s another question schools need to start asking when they look at their marketing data: “How are AI platforms influencing prospective families before they ever reach our website?”
AI is already starting to show up in analytics reports as a source of website traffic. In fact, you may see something like “AI Assistant” alongside Organic Search, Direct, Referral, and other traditional channels.
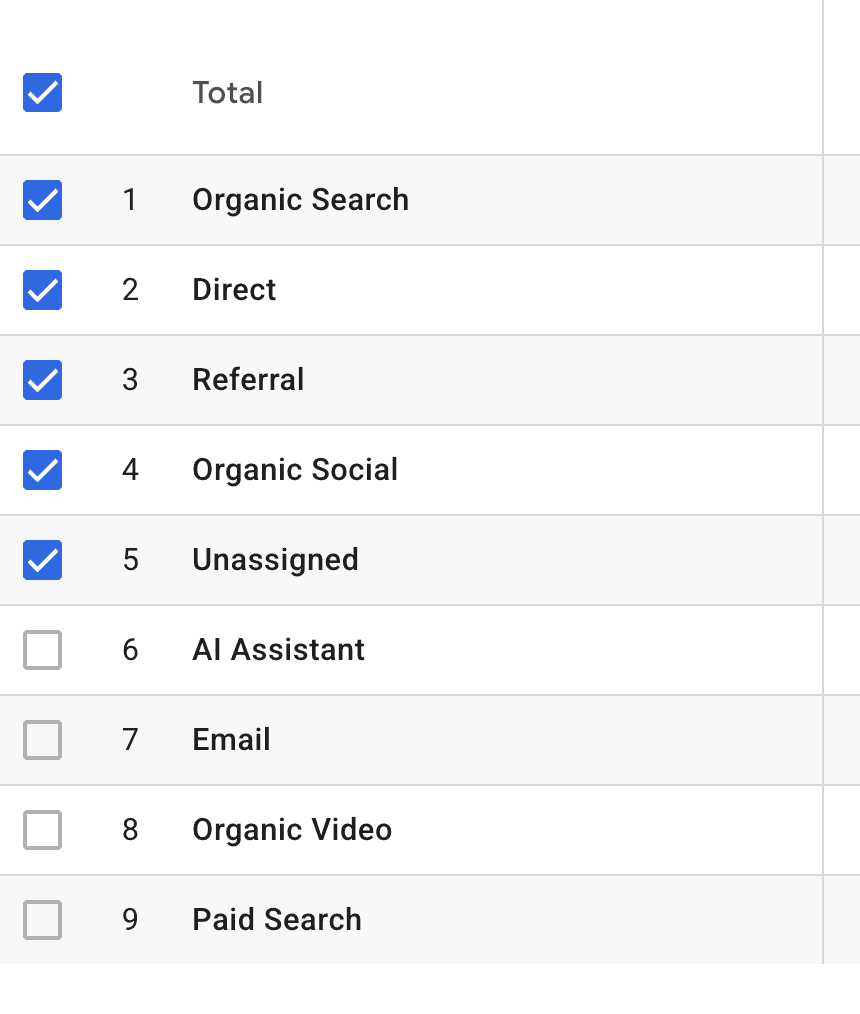
But here’s the thing: GA4 can tell you when someone arrives from an AI platform. It can’t tell you how often your school is being recommended by AI before that person ever clicks through to your website.
A prospective family might ask ChatGPT, Gemini, or another AI platform which schools they should consider, compare your school against competitors, and form an impression of your school before they ever appear in your analytics.
That means the way we think about marketing attribution is changing. It’s no longer just about asking “Where did this visitor come from?” We also need to ask “Were we even visible when they were making their decision?”
That’s why we created the Admissions-Focused AI Visibility Audit. It helps schools understand how they’re represented across AI platforms, benchmark their visibility against competitors, and uncover opportunities to improve how they’re discovered by prospective families.
The new marketing mystery isn’t just where families are coming from. It’s whether they’re finding you at all.
Where are you sending people?
When someone clicks on your ad, what’s the first thing you want them to see?
Is it a blank page with an inquiry form? I hope not. Is it the homepage? Maybe, but with the majority of users on their phone, the homepage can be a bit overwhelming. The answer?
You should send ad traffic to a custom or existing page that introduces your school, showcases engaging photography, highlights upcoming events, and includes a short form to capture interest.
If you want to see the website pages most of your users are visiting, follow these steps: Go back to ‘Reports’ and click ‘Engagement’. Then, select ‘Pages and Screens.’ There should be a mix of ‘admissions’, ‘tuition’, or ‘visit’ pages in your top 10. If you're only seeing the ‘school calendar’, ‘faculty and staff’, and the ‘parent portal’, then you’re likely wasting advertising budget on current families.
Are you reaching the right families?

This one is simple. Look at where your users are coming from.
Do your target cities show up? Or are you seeing a spike in traffic from somewhere that’s 100 miles from your school? That’s usually a geo-targeting issue.
Surprisingly common, and yes, it means you’re paying for people who were never going to enroll anyway.
If you only take away one thing
You don’t need to be an expert in analytics. Start with reviewing the above, and then please, ask questions.

Similar articles
All articles

The Clipboard, a “Trusty” Tool
Back in the day, before touchscreens ruled the world, there was one mighty symbol of authority: the clipboard.
It wasn’t just a tool – it was a badge of honor, used by those in charge with a flair that demanded attention. For many of us, encountering someone with a clipboard meant awaiting our turn at an event or checking in for a school field trip – our names diligently checked off or called out from its wooden surface.
Picture it: a thin brown wooden board, complete with a shiny sliver clip that could snap your fingers if you got too close. It was the same clipboard your great-great-grandparents might’ve seen in 1870 (by the way, the light bulb was invented in 1879), and miraculously, it survived into the 21st century, still going strong at admission events like a timeless relic.

Dan Yorsh
View

Confessions of an Admissions Director : The Power of the Pause
As the final bell rang and the last parent picked up their student, a strange and beautiful hush fell over campus. Teachers submitted grades, students traded backpacks for beach towels, and my team and I traded our admissions hats for – well, still admissions hats, but slightly less frantic ones.
This is our version of summer: not beaches and daiquiris (though, wouldn’t that be nice), but whiteboards, goal-setting, and the annual deep-dive into the past year’s admissions cycle. It’s when we pause, regroup, and ask the most important question no one has time for in February: Did what we do actually work?
Workshop Season: Coffee, Sticky Notes, and Brutal Honesty
Every June, our team blocks out a couple of days for what we affectionately call “Admissions Retreat,” though there’s very little retreating involved. We bring snacks, pull up our calendars, and do the thing we secretly love: analyze, review, and optimize.
This year, as always, we started with events. The open house. The small group tours. The one-on-one tours. And the ever-evolving hybrid sessions where we tried something new – inviting current and prospective families to mingle. In years past, this process meant stitching together spreadsheets, toggling between our EMS, and making educated guesses based on anecdotal wins. Not this year.
Aryval Yield Report: The Data Whisperer We Didn’t Know We Needed
Enter: the Aryval Yield Report. Cue dramatic music – or maybe just the satisfying click of my mouse as I opened the file. For the first time, our event data wasn’t just there. It was talking to us. Clearly. Cleanly. Easy on the eyes, hard on inefficiency.
We could see exactly how each event type performed. Which ones converted inquiries to applications. Which ones converted applicants to enrollments. Which ones just…existed, bless their hearts.
And perhaps most importantly, we finally had capacity yield reporting. Let me tell you: understanding not just how many families attended, but how full the event was relative to what we could handle? Game changer.
The Big Reveal (And the Events That Didn’t Make the Cut)
What did the data say? Well, for starters, those early December tours we kept hosting “just in case”? Yeah. The yield was flatter than the soda in our breakroom fridge. Meanwhile, our smaller, targeted group tours in January punched well above their weight. And hybrid events? Surprisingly effective, especially when current families shared their authentic stories.
With the report in hand, we made some bold decisions. We’re cutting back on events that underperformed. Doubling down on those that delivered. And, for once, doing it all without arguing over conflicting spreadsheets.
Insight Is the Ultimate Relief
When I think back to previous years, our event planning process felt like squinting through fog with a flashlight. This year? It felt like flipping on overhead lights. We moved from gut feelings to grounded strategy. And the team felt it too. I saw nods instead of furrowed brows. “This makes so much sense,” Liz said, with the relieved tone of someone who just found the charger they swore was lost forever.
Looking Ahead
We’re not done yet, of course. No one in admissions ever really is. But this moment, the end of the school year, the quiet before the next storm has become sacred for us. Not because we stop working, but because we finally get the space to work smart.
So yes, summer planning still involves sticky notes and strong coffee. But now, it also includes clear-eyed decisions powered by real insights. And if that’s not progress, I don’t know what is.
Until next season,
Your resident data-driven admissions romantic

Annalee Neukam
View

The Power of Automation
Struggling to meet enrollment targets in your independent school? You’re not alone. Every school faces one of three paths:
My enrollment is low and I want to increase it
My enrollment is steadily increasing and I'd like to start building a waitlist
My enrollment is full, my waitlist is growing, and we're adding more classrooms (which brings us back to #1)
The ultimate goal? Path 3: full enrollment and a growing waitlist. But how do you get there?
It starts with a strong marketing and admissions team, working together seamlessly, and a process for managing leads from inquiry through application.
This is where automation comes into play. ‘Automation’ may be a scary word, or it may conjure up feelings of impersonalization, but automation has evolved to become more personalized and efficient than ever before.
Jonathan Remis
View